Teardowns, playbooks, and the numbers behind creator-led growth. Every figure sourced, written from campaigns we actually ran.
iOS cost per install hit $5.84 in 2026, up 19% year over year and 2-3.5× Android. Here is what actually drives app acquisition cost and which levers are worth pulling.
Brands testing 10+ creative concepts a month see 31% lower CPA than those testing fewer than five. Here are the 2026 volume benchmarks by spend tier, and the math behind why volume is the lever.
UGC videos average $150-$212 each in 2026, with usage rights adding $100-$300. Here is what brands actually pay per video, per creator, and per agency retainer, and what drives the difference.
Most brands source UGC creators on follower count and get burned. Here is what actually predicts performance, where to find creators, and the vetting checks that prevent the common failures.
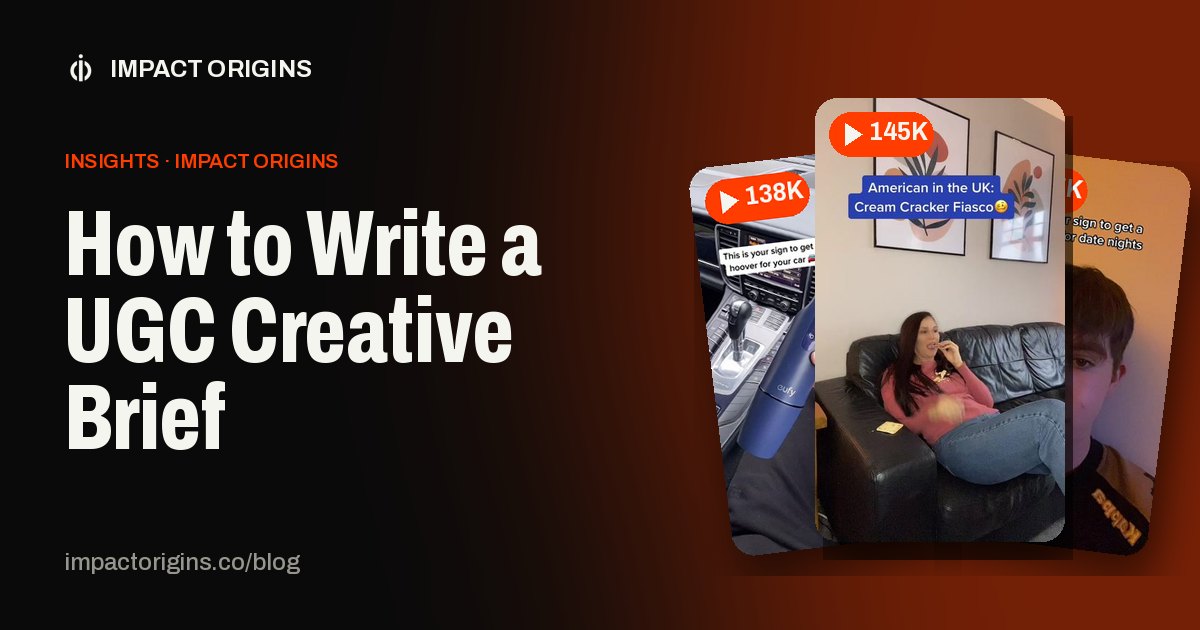
Most UGC briefs over-specify the script and under-specify the outcome. Here is the structure that produces usable assets on the first pass, and the five things a brief must contain.
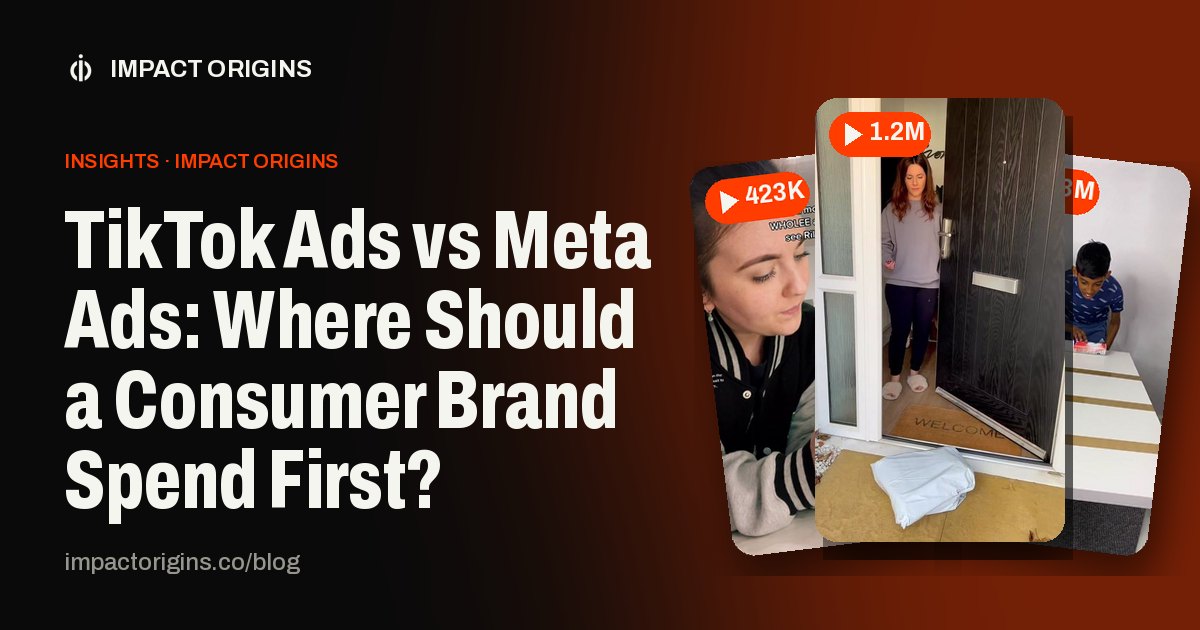
TikTok's median CPM is $4.08 against Meta's $15.06, and TikTok's median CPA runs lower, but the creative requirement is stricter and attribution is noisier. Here is how to decide.
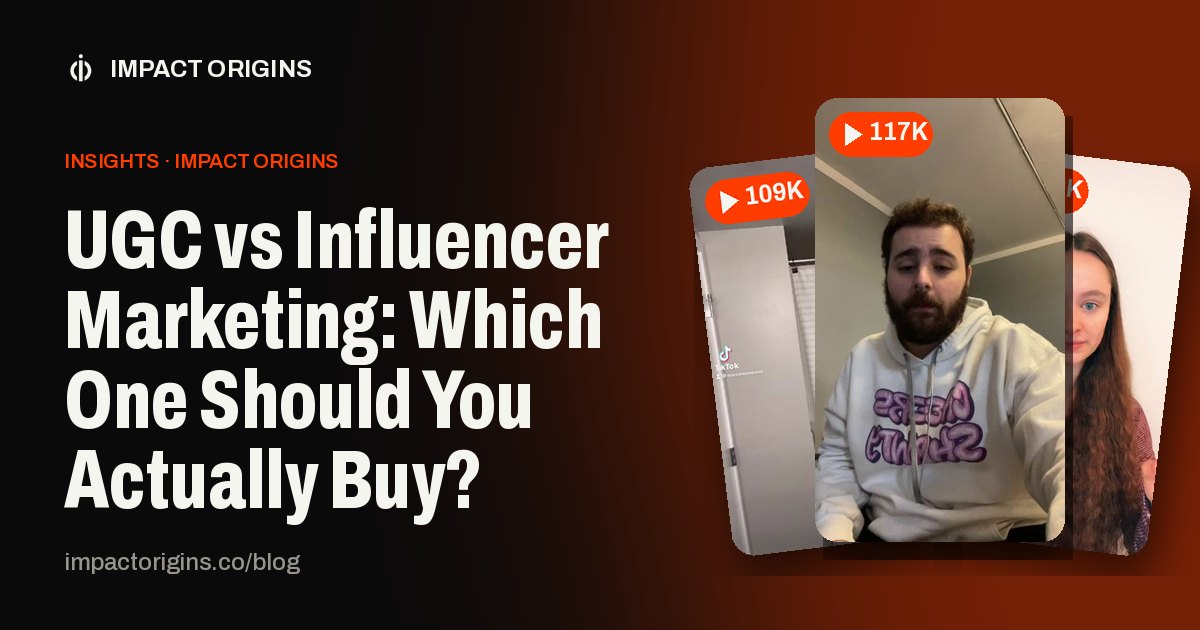
UGC buys a creator's production skill. Influencer marketing buys their audience. They solve different problems, cost 30-80% differently per result, and most brands buy the wrong one for the problem they have.
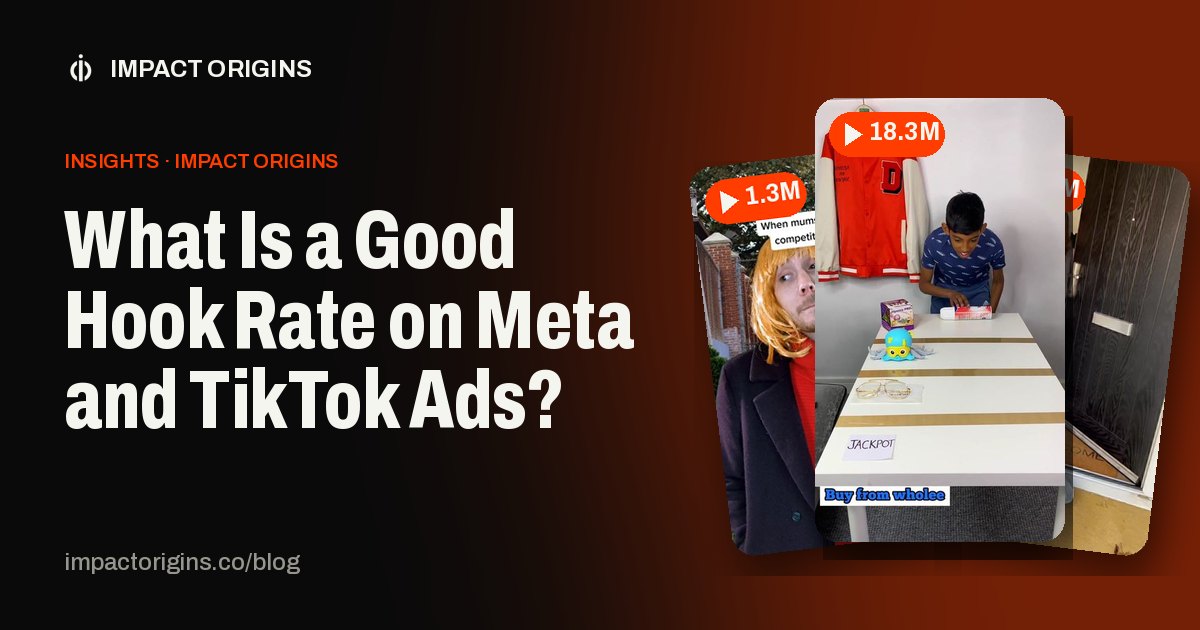
A hook rate of 30% or better is the 2026 working benchmark on Meta, with elite creative reaching 35-45%. Below 25% needs fixing. Here is how to read hook rate, hold rate and thumbstop together.